
Figure 5. Histograms of Cα RMSD as a function of temperature for conventional MD and REMD simulations.
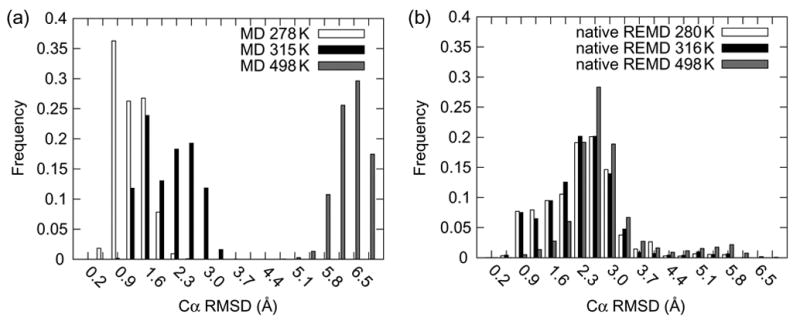
(a) Histograms of Cα RMSD for the final 10 ns of the conventional MD simulations performed at 278, 315 and 498 K. Notice the clear delineation of native and nonnative conformers at about 2 Å, the value used by Pitera and Swope (Pitera and Swope 2003) to denote folded and unfolded states. The 278 and 498 K simulations, below and above Trp- cage’s Tm, respectively, yield mean Cα RMSD’s corresponding to native and nonnative states by this definition. The 315 K simulation, at the experimentally determined Tm (Neidigh et al. 2002; Qiu et al. 2002) exhibited a bi-modal distribution just inside and outside the native cutoff. (b) Histograms of Cα RMSD from the native REMD simulation from the 280, 316 and 500 K replicas. These distributions overlap significantly and do not reflect temperature dependent conformational sampling.