
Fig. 6.
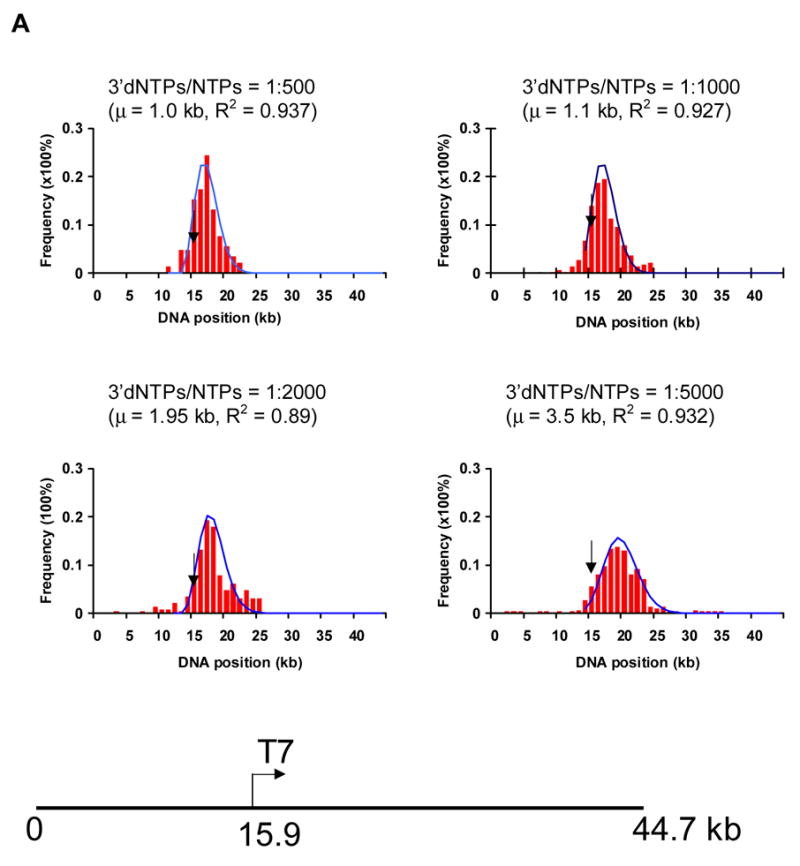
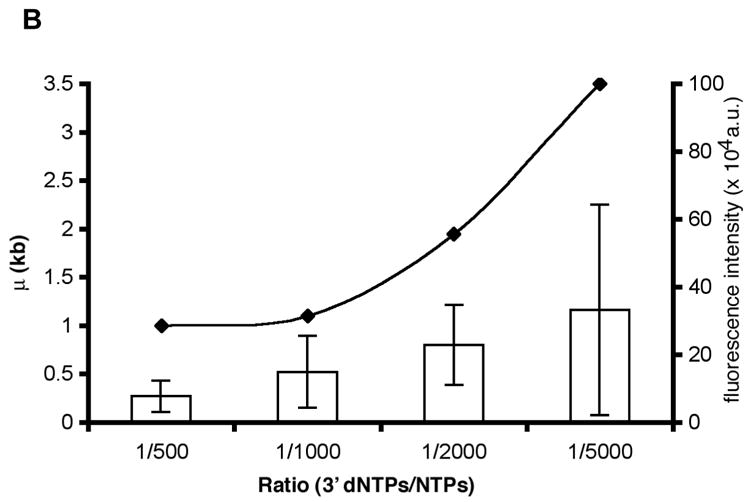
Assessment of positions of ECs along single template molecules in transcription reactions conducted at decreasing levels of 3′ dNTPs. A) The histograms show the distribution of ECs on the linear cosmid DNA (LANL-16c_380H5) from reactions conducted with ratios of 1:500, 1:1000, 1:2000 and 1:5000 of 3′dNTPs to NTPs. The arrow in each histogram indicates the location of the T7 promoter (at 15.9 kb; see diagram of LANL-16c_380H5 below). The frequency of the distribution of ECs is normalized with respect to the total number of ECs analyzed for each histogram. (Approximately 100 to 200 ECs were analyzed for each histogram.) The smooth curves represent fits to a Poisson, with regression fit (R2) and calculated mean value (μ) shown for each graph. μ corresponds to the average distance of ECs downstream of the promoter. B) The ratio of 3′dNTPs/NTPs is plotted vs μ (kb) and vs. the average integrated fluorescence intensity of ECs. The average distance of ECs downstream from the promoter (μ) increases with decreasing ratios of 3′dNTPs/NTPs. Error bars in the bar graph were calculated as the standard deviation on sets of ECs. (138, 100, 92 and 123 measurements were made for reactions conducted at 1:500, 1:1000, 1:2000 and 1:5000 ratios of 3′dNTPs/NTPs, respectively.) The integrated fluorescence intensity was calculated for each stalled EC. The arbitrary units represent the grey value from pixels of ECs.