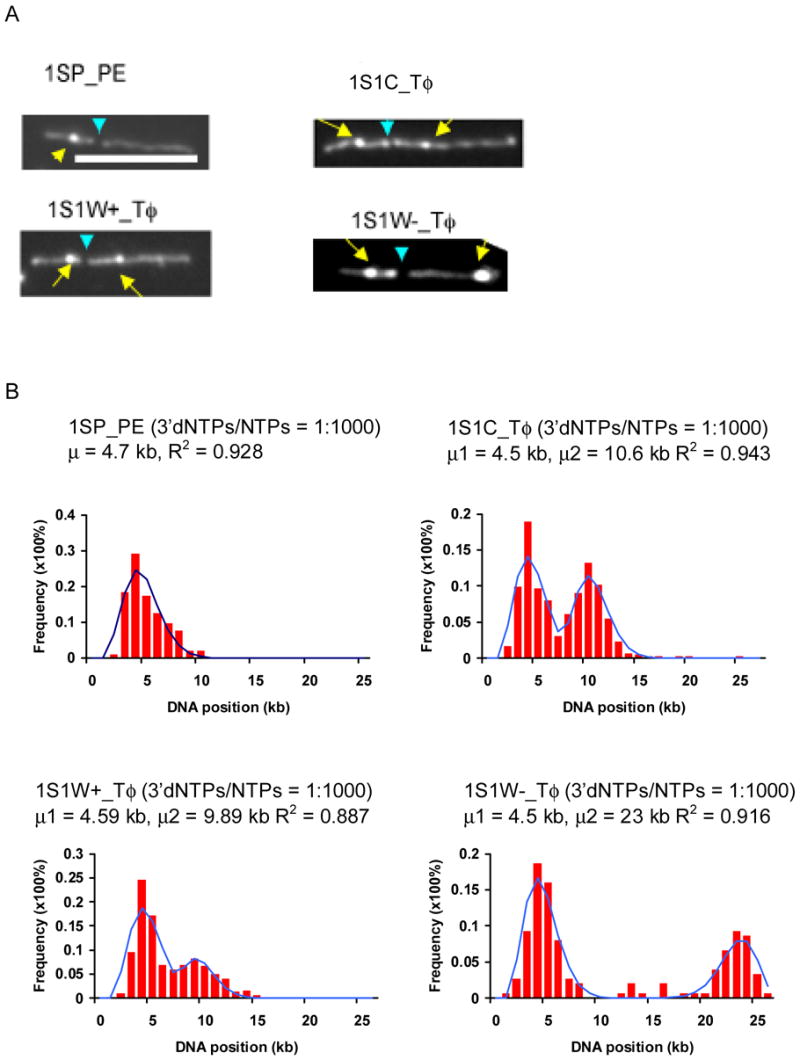
Fig. 7.

Localization of promoters on the template DNAs 1SP_PE, 1S1C_Tφ, 1S1W+_Tφ, and 1S1W-_Tφ. A) Representative images of surface-mounted transcription reactions supported by 1SP_PE, 1S1C_Tφ, 1S1W+_Tφ, and 1S1W-_Tφ. Yellow arrows point to prominent ECs, and blue arrows to BamH I restriction sites. The two discernible BamH I fragments are 8.3 and 16.8 kb for 1SP_PE; 10.3 and 16.8 (1S1C_Tφ); 9.6 and 16.8 (1S1W+_Tφ), and 8.9 and 16.8 (1S1W-Tφ). (White bar: 5 μm). B) Histograms show the distributions of ECs on template DNAs at ratios of 3′dNTP to NTP of 1:1000. The solid plots are the Poisson curve fits with shown regression fit (R2) and calculated mean value (μ) for each graph. (100–200 molecules were analyzed for each graph.)
