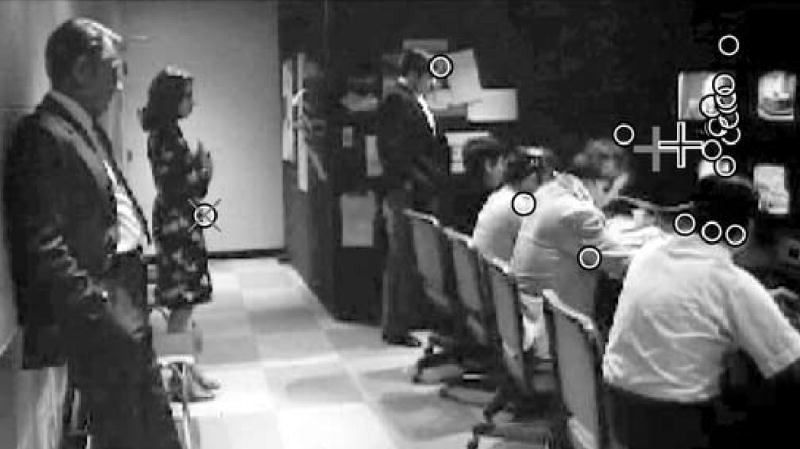
Fig. 2.

The gaze points (calibrated eye movement data) of the 19 (out of 20) subjects with valid eye samples for a representative subframe (number 1700) of the movie-clip “Network” are shown as black and white circles. The positions were superimposed on a monochrome rendering of this video frame that was modified to improve visibility of features of the scene. Removal of the outlier (circle with the grey ×) reduced the BVCEA (measure of the spread of the gaze points) from 31.1 deg.2 (degrees square) to 19.5 deg.2 (37%). The data are plotted on the 26.3 deg. × 14.8 deg. movie scene (rectangle). The grey and white crosses mark the prior and subsequent COIs (mean of the gaze points), which moved by only 1.0 deg. on removal of the outlier. Note that this COI would be outside the screen for most magnification levels if magnification were to be centered at the center of the movie scene.
