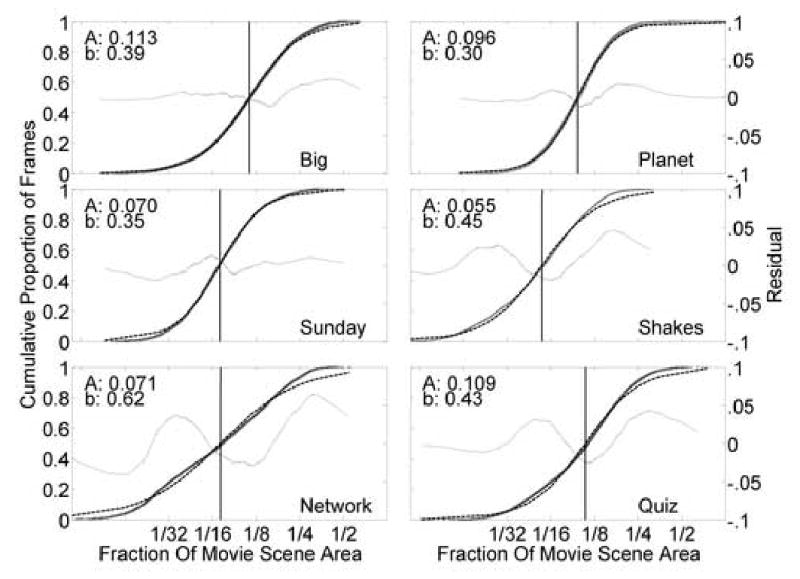
Fig. 3.

For each movie-clip subframe, after removing outliers (see Fig. 2), the spread of the gaze points was estimated using the BVCEA, reported here as a proportion of the movie scene area. Only those subframes where 15 or more subjects had valid eye samples were used (see Fig. 1). The cumulative curves (heavy lines) show the actual proportion of the total subframes for which the BVCEA was less than a given fraction of movie screen area. Loge transforms of the distributions were fitted to a logistic function (dashed lines) that were then used to calculate the screen fraction for which half of the samples had a smaller BVCEA (A: vertical line and the value indicated by the inset). The residuals of the fits are shown (thin lines - see right y-axis for scale).
