
Fig. 4.
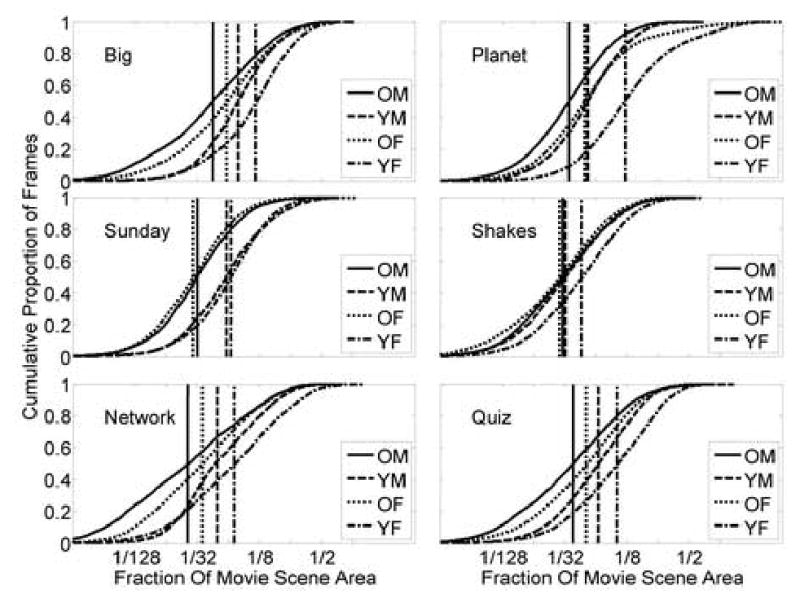
Similar to Fig.3, the cumulative distributions of the BVCEA and positions of A are shown for each movie clip and for each age-gender group (for subframes where at least 4 out 5 subjects had useable data). Older and male groups had smaller spreads of their gaze points (smaller BVCEA) than younger and female groups, respectively. The fits used to derive the positions of the vertical lines are not shown.