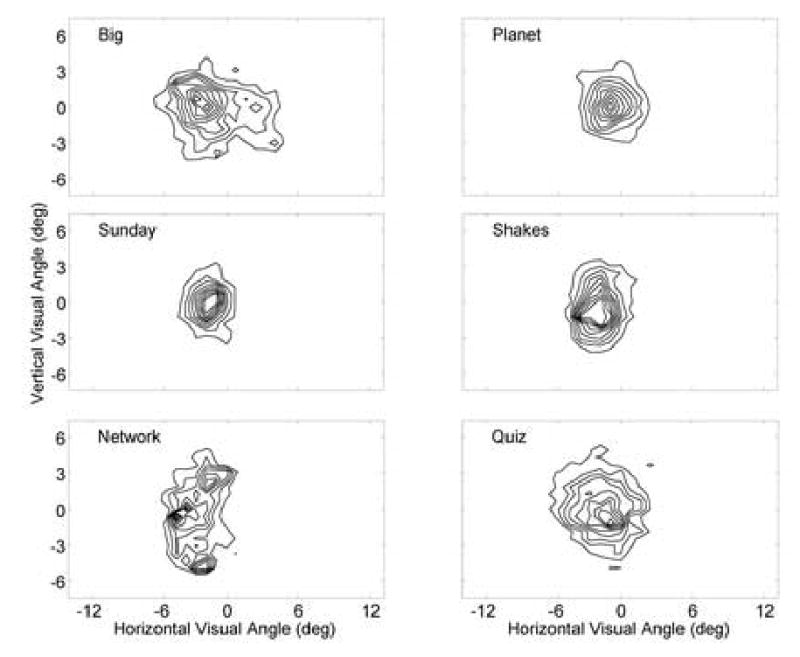
Fig. 6.

COI distributions computed for all movie clips for all subjects (for subframes with eye samples available for at least 15 subjects) are shown as a topographic map (derived from 28 by 21 bins). The borders represent the movie scene area. Data were normalized so that the maximum was 1.0 and levels were drawn at 0.1 intervals. Although generally, the distributions peaked near the center of the screen, the spread indicates that a large proportion of the time, subjects did not look at the center of the movie scene.
