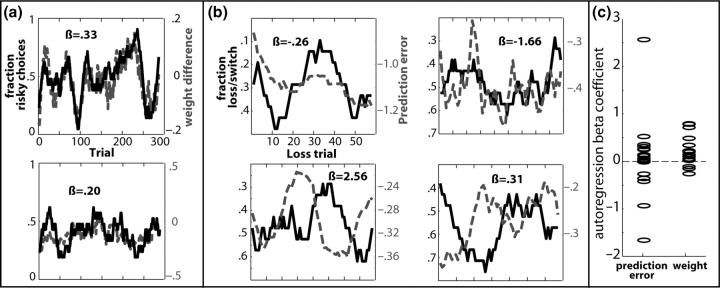
Fig. 2.
Model outputs predict behavioral choice data. Plotted are the local fraction of choosing the high-risk option (a) and choosing the opposite decision following nonrewards (b) represented as the solid black line, and the difference in the model's high- vs low-risk decision option weights (a) and the prediction error on each trial (b) represented as the dotted gray line. Results are displayed from six separate subjects. (c) Displays the β-coefficients for each subject.

