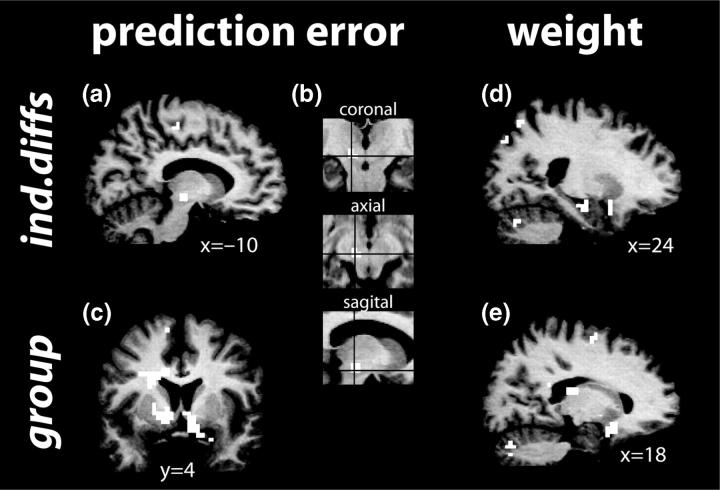
Fig. 3.
Group activation maps depicting brain regions in which activity correlated with the prediction error term (a–c) and difference in weights (d,e) for the model using individual differences in learning parameters (a,b,d) or group-defined parameters (c,e). Insets in (b) show precise location of midbrain activation.

