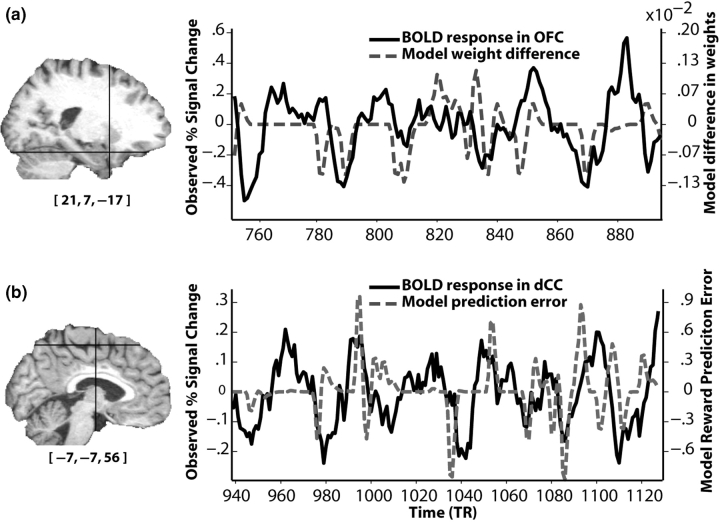
Fig. 4.
BOLD responses from a single subject correlate with variables predicted by the individual differences model. (a) Correspondence between BOLD signal from the maximally significant voxel in orbitofrontal cortex (OFC; solid black line) and the difference of the high- and low-risk weights calculated by the model (dotted gray line). (b) The BOLD response from the maximally significant voxel in dorsal cingulate cortex (dCC; solid black line) and the model's prediction error, convolved with a hemodynamic response function (dotted gray line). Cross-hairs in the T1 display the position of the voxel (MNI coordinates displayed under the T1). BOLD responses are low-pass filtered for illustration purposes.

