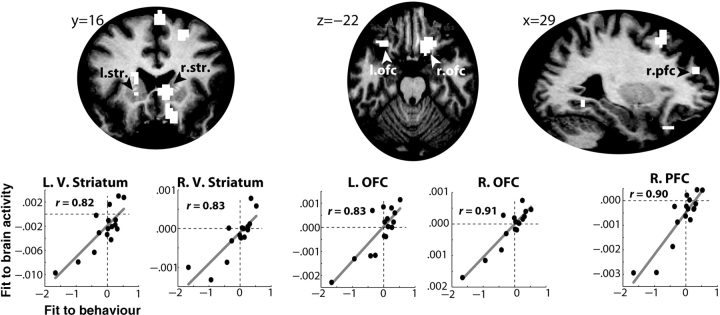
Fig. 6.
The model fit to behavior predicted the model fit to brain activity in striatum and prefrontal cortex. The top row displays a selection of brain regions in which this correlation was significant. Scatter plots depict the relationship between model fit to behavior (unstandardized β-coefficient between model's prediction errors and subjects’ stay/switch decisions; X-axis) and model fit to brain activity (average unstandardized parameter estimates from all voxels in the indicated region; Y-axis) in selected regions. Note that the X- and Y-axes display unstandardized β-coefficients and are thus their magnitudes are not directly comparable. L, left; R, right; V, ventral; str., striatum; OFC, orbitofrontal cortex; PFC, prefrontal cortex.

