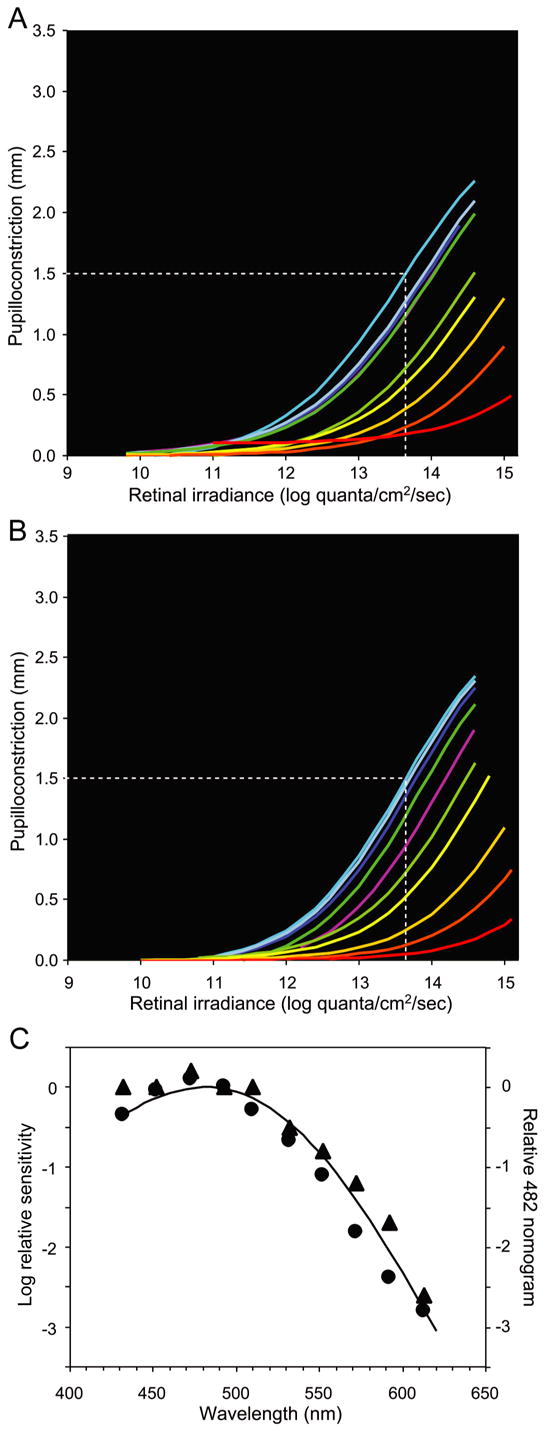
Figure 3.

Post-stimulus, sustained pupillary responses of macaques under normal conditions and during pharmacological blockade. (A) Retinal irradiance-pupillary response plots under normal conditions. (B) Retinal irradiance-pupillary response plots after pharmacological blockade. In both A and B, the white dotted line indicates the retinal irradiance at 470 nm required to produce half-maximal pupilloconstriction, line color represents an approximation of stimulus wavelength, and Pmax = 3.0 mm was used for fitting the Hill equations. (C) Spectral sensitivity data derived from panels A and B. The solid curve, a Vitamin A1 pigment nomogram with peak sensitivity at 482 nm, closely matches the data obtained both under normal conditions (▲, R2 = 0.98) (Best fit λmax 483 nm) and during pharmacological blockade (●, R2 = 0.97) (Best fit: λmax 476 nm).
