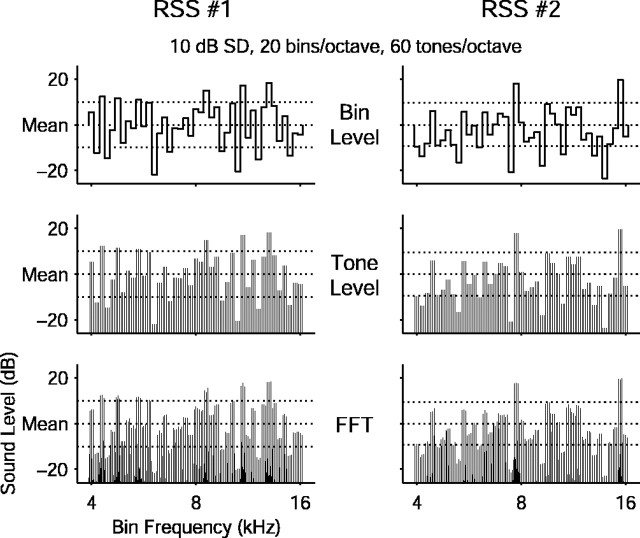
Figure 1.
Example random spectrum stimuli (RSS) from the same set. Two RSS from the same stimulus set are shown plotted as bin levels (top), tone levels (middle), and amplitude spectra (bottom). The bins have a level SD of 10 dB over the entire set, indicated by horizontal dotted lines. All of the stimuli span two octaves of frequency from 4 to 16 kHz with 20 bins per octave. Each bin contains three logarithmically spaced tones of the same level for a density of 60 tones per octave. This set contained an additional 41 stimuli, including the stimulus with all bin levels at the mean value (i.e., the flat-spectrum stimulus).

