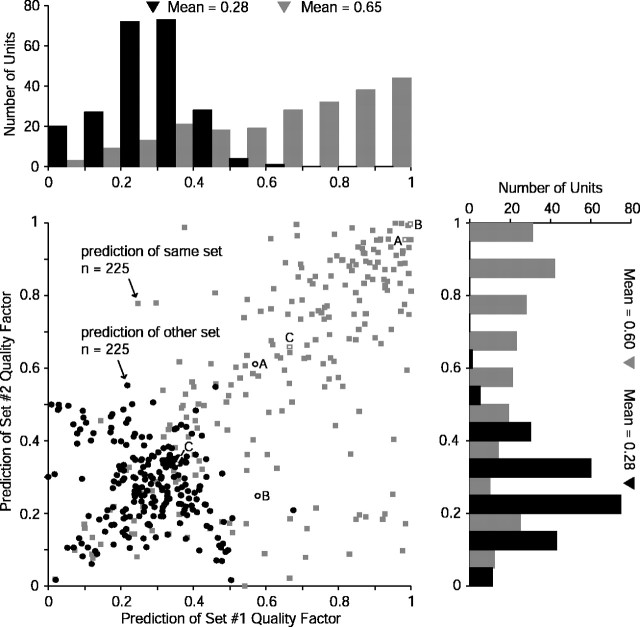
Figure 11.
Population RSS prediction quality. Quality factors for same-set (gray rectangles) and other-set prediction (black circles) are shown for each of the 225 units tested with complementary RSS sets. Data are plotted as prediction of set 1 (abscissa) against prediction of set 2 (ordinate). Marginal distributions are shown above and to the right. Many same-set predictions are of high quality, indicating that the linear model derived from RSS could be potentially appropriate for these units. Low quality factors for the other-set predictions in this, the easiest possible predictive task (i.e., test stimuli linearly related to the training stimuli), however, indicate substantial nonlinearities in the rate responses of auditory cortex neurons. Labeled data points indicate the examples from Figure 10.

