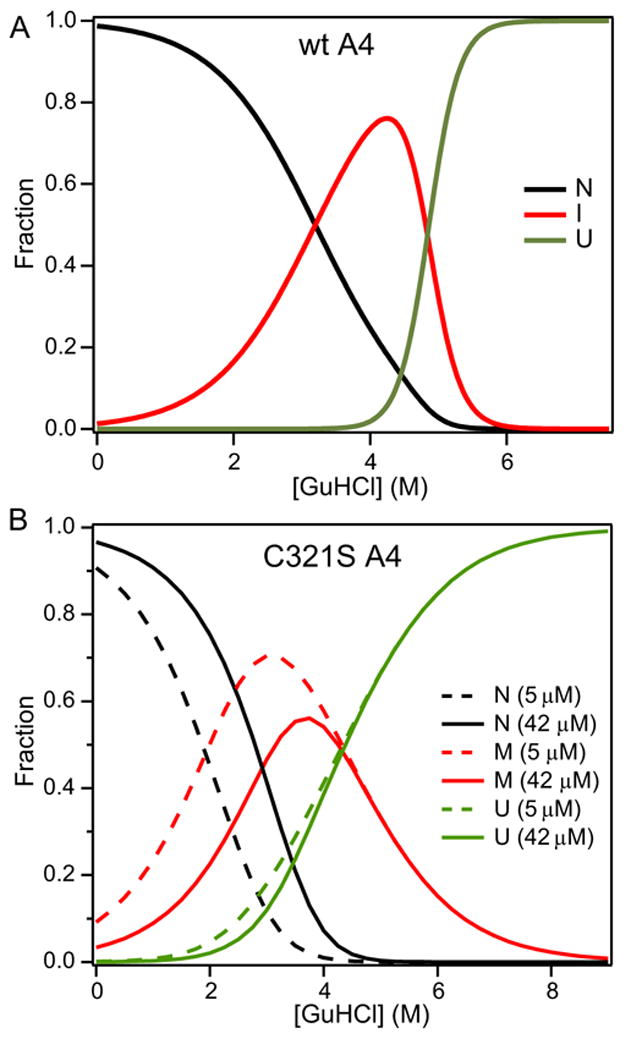
Figure 4.

Relative populations of native (N, black lines), intermediate (I, red lines), and unfolded (U, green line) states of (A) wt A4 (20 μM) and (B) C321S A4 protein at 5.1 μM (dashed) and 42 μM (solid) as a function of GuHCl concentration. The populations for wt A4 (A) were calculated from a unimolecular three-state model (equation 1), using the parameters obtained by fitting the data in Figure 2. The population for the dissociable C321S mutant (B) were calculated from equation (4), which describes a three-state dimer-dissociation/unfolding transition with monmeric intermediate (Scheme 3), based on the fit of the CD and fluorescence data in Figure 2 (cf. Table 1).
