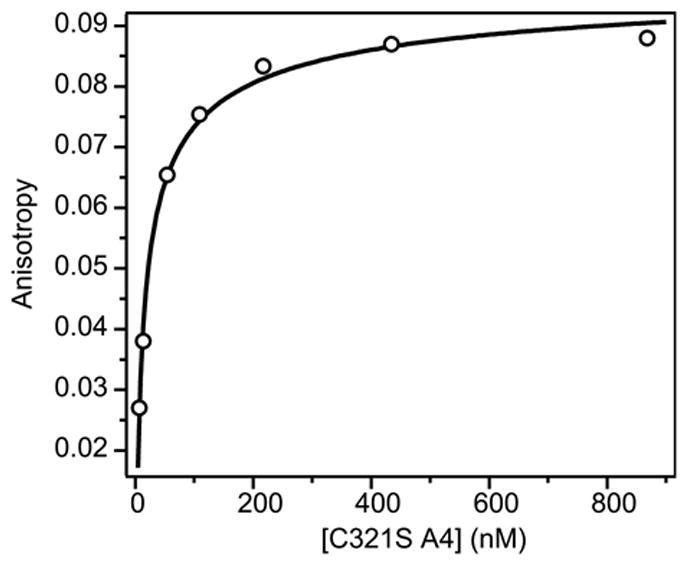
Figure 7.

Dimer dissociation of fluorescence-labeled C321S A4 observed by fluorescence anisotropy. The fluorescence anisotropy of C321S A4-AF488 (circles) is plotted vs. total protein concentration in nM (per monomer). The line represents a fit of a dimer-monomer equilibrium model (equation 7).
