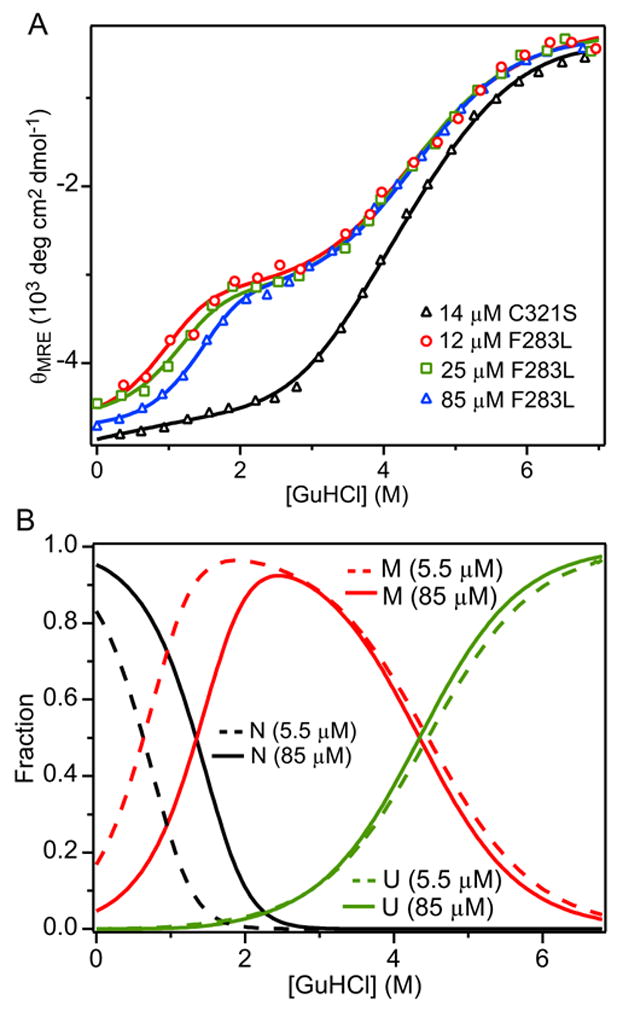
Figure 9.

Unfolding/dimer-dissociation equilibrium of F283L/C321S A4. (A) CD signal at 225 nm vs.GuHCl concentration measured at protein concentrations 12 μM (red circles), 25 μM (green squares), and 85 μM (blue triangles) along with global fits of a three-state unfolding model with monomeric intermediate (lines). The unfolding transition for 5.1 μM C321S A4 (cf. Figure 2A) is shown for comparison (black triangles). (B) Relative populations of native (black lines), intermediate (red lines), and unfolded (green lines) states for 5.48 μM (dashed) and 84.8 μM (solid) F283L/C321S A4 protein vs. GuHCl concentration obtained using the global fitting parameters in Table 1.
