
Figure 4.
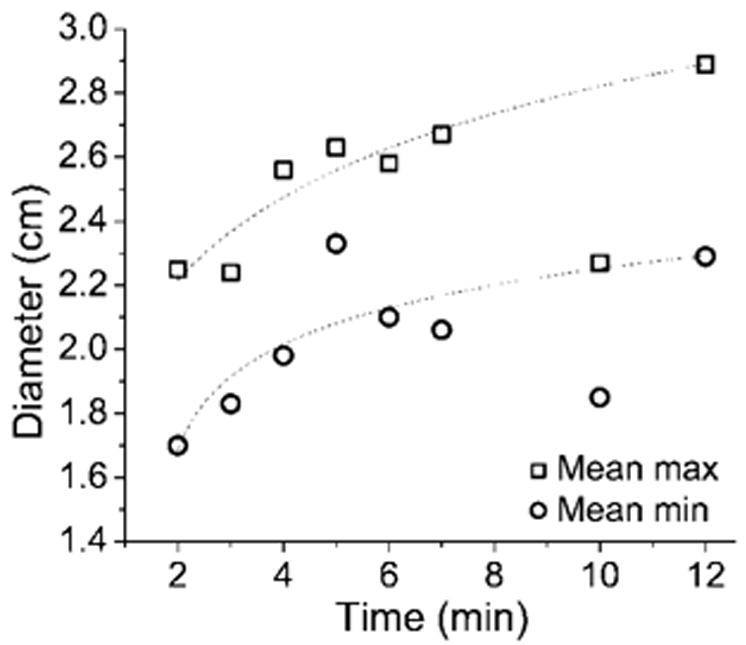
Graph of mean minimum (min) and maximum (max) ablation zone diameter versus application time. Logarithmic dependence on application time similar to results of previous numeric and ex vivo studies was seen (11). Relatively small increases in ablation diameter were seen after 5 minutes. Anomalous points at 10 minutes are thought to be caused by an abnormally high perfusion rate and overused antennas.