
Fig. 2.
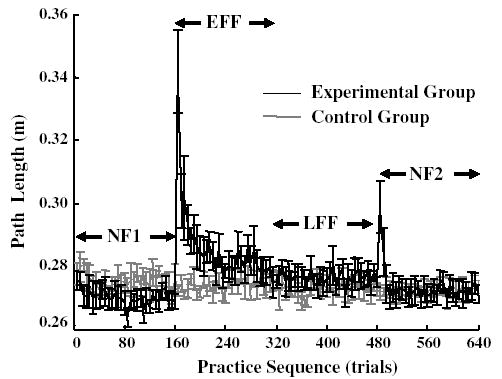
Path length (mean and standard error) is plotted against trial sequence. The black and gray lines represent the experimental and the control subjects, respectively. Each point represents the average of five consecutive trials per subject then averaged across subjects