Fig. 3.

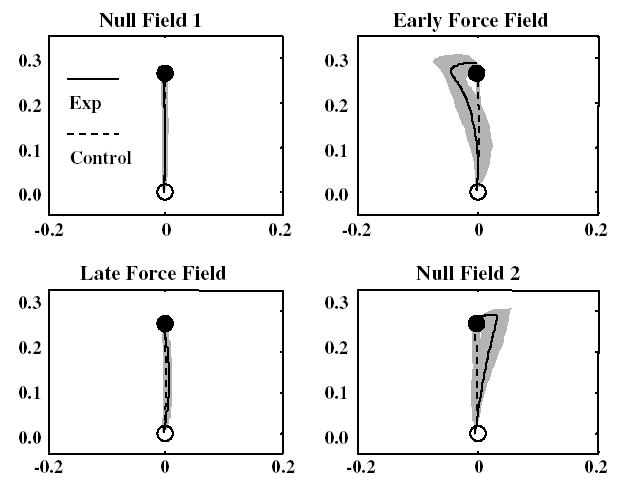
Average hand paths for a representative subject during reaches performed in the four adaptation phases. The dashed line represents the hand path of the control group during the same phase. Shaded area is one standard deviation

Average hand paths for a representative subject during reaches performed in the four adaptation phases. The dashed line represents the hand path of the control group during the same phase. Shaded area is one standard deviation