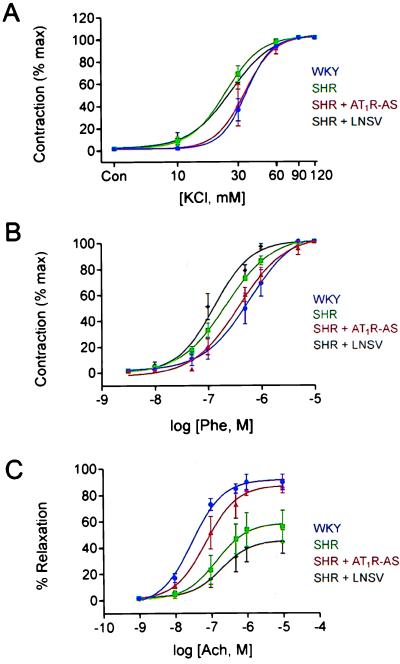
Figure 2.
Mean concentration–response relationship to KCl (A), Phe (B), and ACh (C) in rat renal artery. The Phe and KCl dose–response curve was shifted to the left in SHR (▪) and SHR + LNSV (♦) when compared with WKY (•) and SHR + AT1R-AS (▴). The ACh dose–response curve was shifted to the right, and the maximal relaxation was decreased in the SHR and SHR + LNSV when compared with WKY and SHR + AT1R-AS. This shift was prevented in all intervention with delivery of AT1R-AS. Data are presented as mean ± SE (n = 6).

