
FIGURE 2.
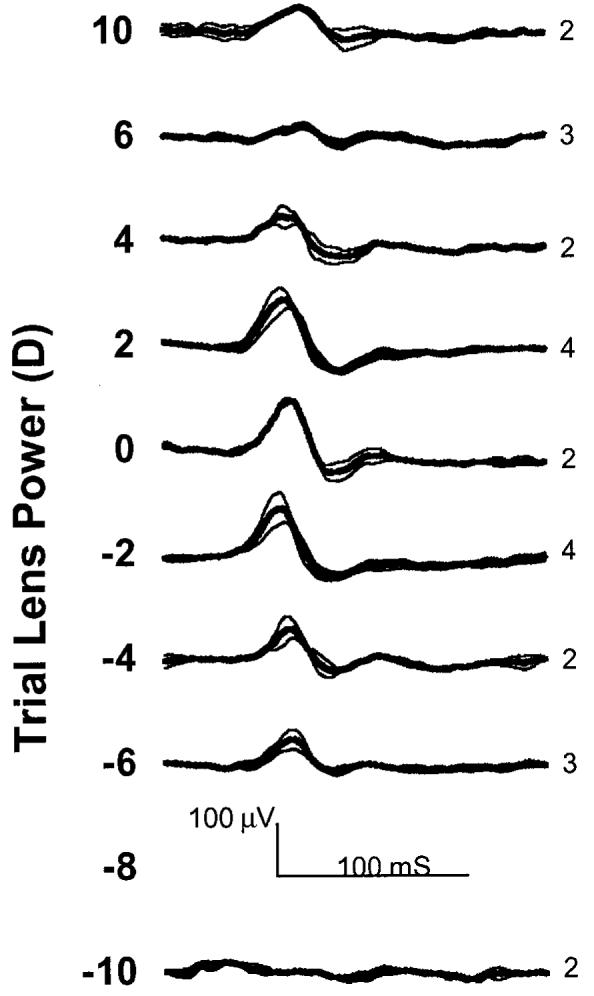
Visual evoked potentials recorded the same tree shrew (0028) as in Fig. 1 but using smaller check sizes (0.25° × 0.29°, ∼1.9 cpd). The tuning (change in first positive peak [P1] amplitude with trial lens power) is shown graphically in Fig. 3. Numbers to the right of each line indicate the number of waveforms that were averaged with this check size and trial lens power in this recording session. The thin lines indicate ±1 SD in response amplitude.