
FIGURE 3.
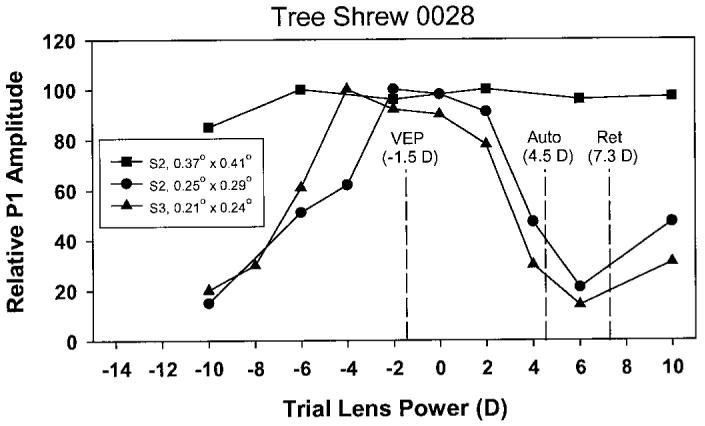
Plots of first positive peak (P1) amplitude (normalized to the largest P1) vs. trial lens power measured in visual evoked potential (VEP) recording sessions 2 (S2) and 3 (S3) in animal 0028. In session 2, the first positive peak (P1) amplitude of the VEP's was high for all lenses when a large checkerboard pattern was used (Fig. 1). When a smaller check size was used (Fig. 2), the largest P1 amplitudes occurred with lenses near 0 D(−2 D to +2 D). Measures made several weeks later (session 3) with a small check size showed a similar tuning of the P1 amplitude (−4 D to +2 D). Combined with tuning obtained in session 1, the best trial lens power was determined as −1.5 D (indicated by the vertical dashed line). The average measures obtained with streak retinoscopy (Ret) and the autorefractor (Auto) were more hyperopic. The check sizes used (W × H in degrees) are indicated in the box.