
FIGURE 5.
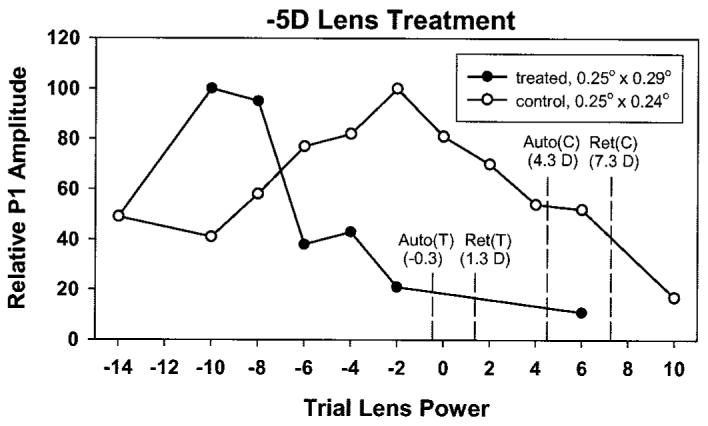
Plots of normalized first positive peak (P1) amplitude vs. trial lens power measured in an eye that had compensated for a −5 D lens (treated eye [T]) and the untreated fellow eye (control [C]) in animal 0065. As indicated in the box, small check sizes were used for both eyes. The average streak retinoscopy and autorefractor measures are also indicated in the Figure.