
FIGURE 6.
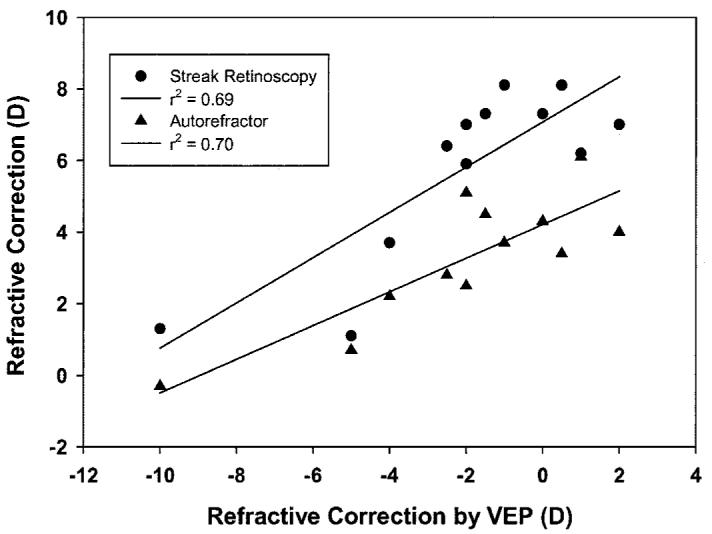
Plot of refractive values measured with streak retinoscopy and the autorefractor vs. values measured with visual evoked potentials (VEP's) for all eyes. The regressions were VEP × 0.47 + 4.2 D for the autorefractor and VEP × 0.63 + 7.1 D for streak retinoscopy.