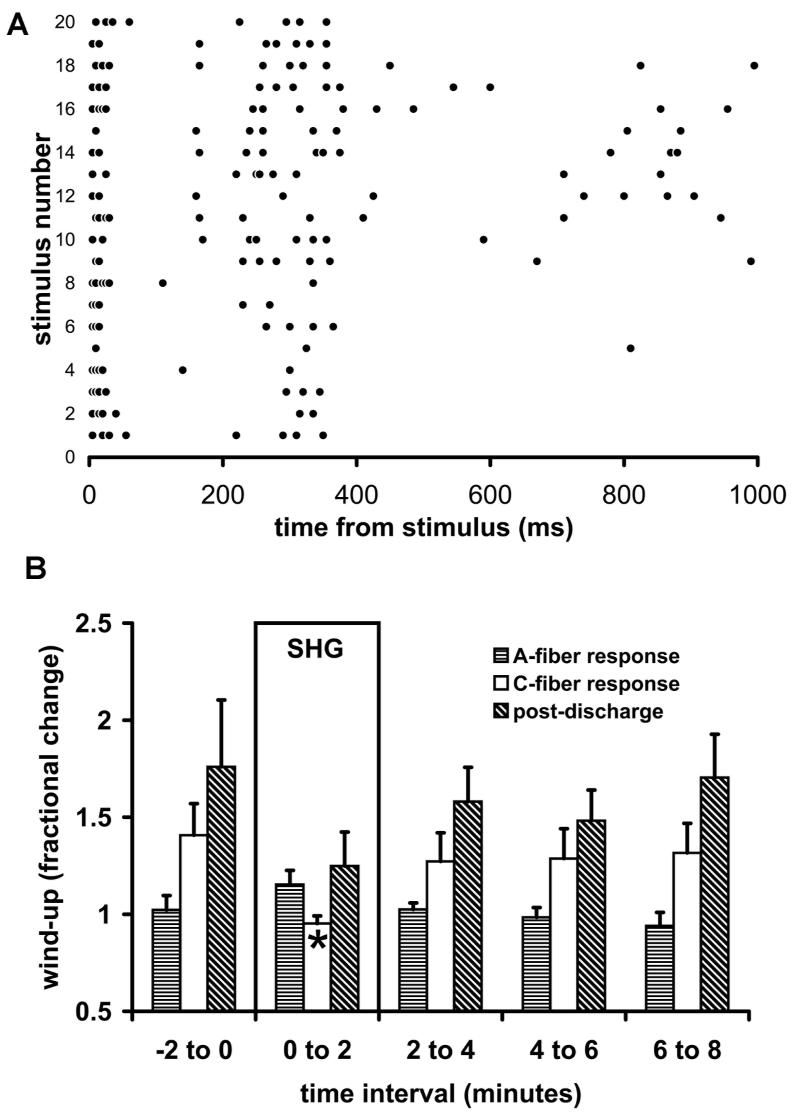
Figure 2.
Effect of SHG on wind-up. A: An example of a wind-up response in the absence of SHG to a 20-scond trial of 1-Hz peripheral stimulation in one cell. Dots represent single action potentials and each line of dots is shifted upward for each succeeding stimulus. The clustering of A-fiber and C-fiber responses in their time-windows, and the growth of the post-discharge is illustrated. B: Mean change in A-fiber responses, C-fiber responses and post-discharge following application of SHG (60-100 nA) for 2 minutes (n=8 neurons).

