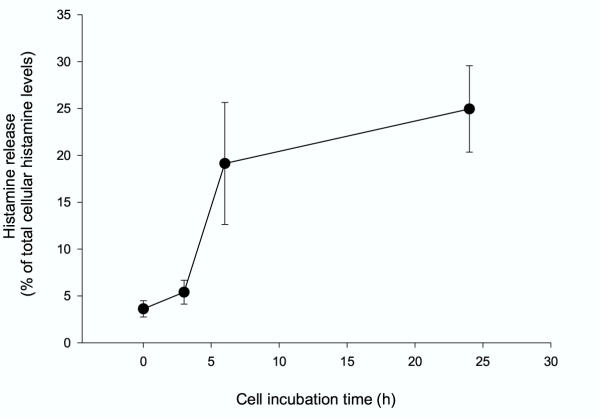
Figure 1.
Histamine release from HMC-1 cells. Histamine release was measured at different time points: 0, 3, 6 and 24 h and calculated as a percent of the total cellular histamine content. Each point represents mean ± S.D. of five or six separate experiments. Histamine release increases from 4 % to 25 % over time (p < 0.05).

