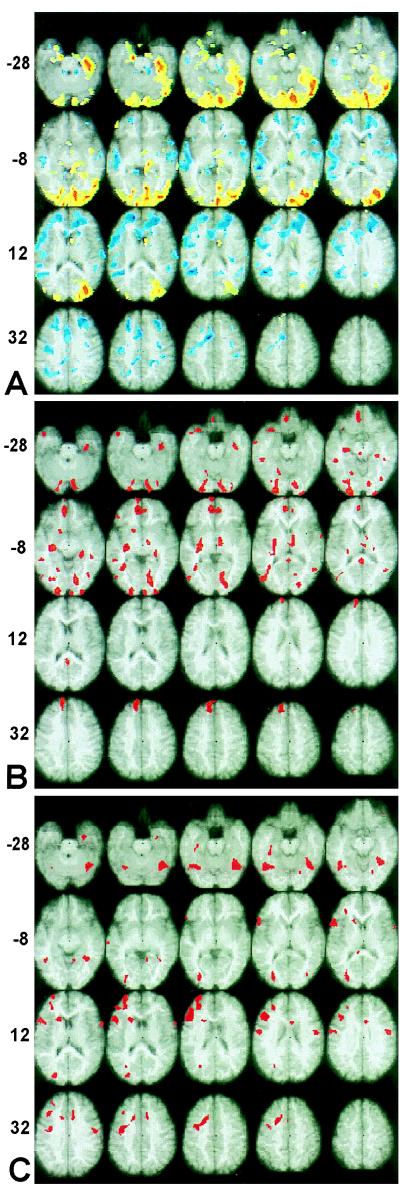
Figure 1.
Voxels shown in color are those that best characterize the patterns of activity identified by LVs 1–3 from the PLS analysis (see Materials and Methods). Areas are displayed on a standard magnetic resonance image from −28 mm to +48 mm relative to the anterior commissure-posterior commissure (AC-PC) line (in 4-mm increments). Numbers shown on the left indicate the level in mm of the

