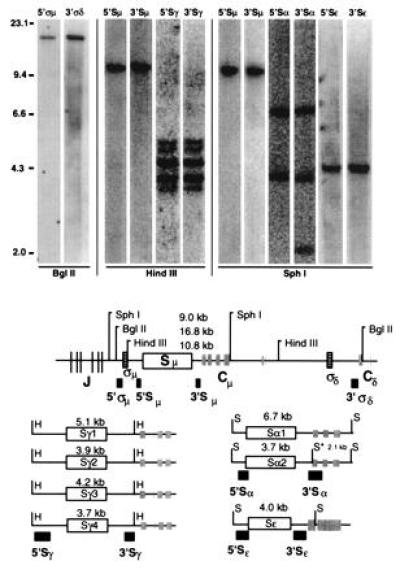
Figure 2.

(Upper) Southern blot analysis of germ-line IgH switch regions. Placental genomic DNA was digested with the indicated restriction enzyme, subjected to electrophoresis on a 0.7% agarose gel, blotted, probed sequentially with various switch probes, and scanned on a PhosphorImager (Molecular Dynamics). The probe is shown above each lane, and lambda HindIII markers are indicated at the left. (Lower) The positions of switch regions (open rectangles), sigma sequences (boxes with horizontal lines), joining region and constant region exons (shaded boxes and lines), 5′ and 3′ switch probes (filled boxes), and restriction sites (S, SphI; B, BglII; H, HindIII) are indicated. The asterisk indicates a SphI site that is present in the 3′ Sα probe and the alpha-2 locus, but not the alpha-1 locus. With the exception of one fragment detected uniquely by the 3′ Sα probe (see text), all 5 pairs of probes cohybridize to the same respective fragment(s).
