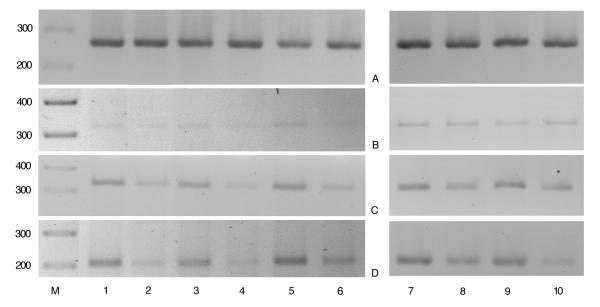
Figure 2.
Expression levels of CB1, CB2 and FAAH mRNAs in patients in acute phase of schizophrenic illness and following pharmacologically-induced remission of the symptoms. The expression levels were evaluated by RT-PCR as described in the methods. Lanes 1, 3, 5, 7, 9: patients n° 3, 6, 8, 5 and 7 (see Table 1), in acute phase; lanes 2, 4, 6, 8 and 10: patients n° 3, 6, 8, 5 and 7, in remission. Panel A, B, C and D are relative to PCR analysis for β2-microglobulin (house-keeping), CB1, CB2 and FAAH, respectively. The bands shown in the figure are from 20 (Panel A), 35 (Panel B), 30 (Panel C) and 30 (Panel D) PCR amplification cycles.

