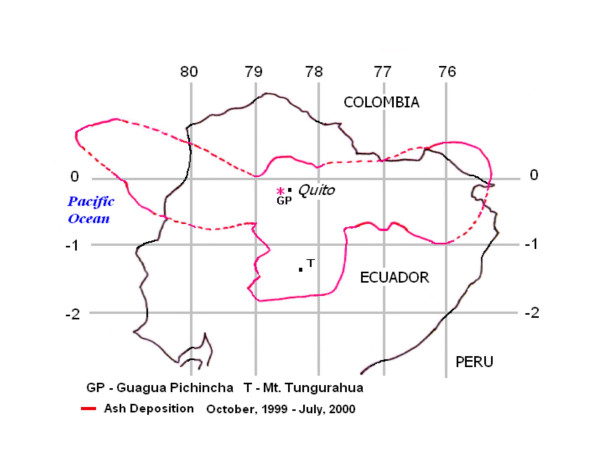
Figure 4.
A composite map of ash deposition from Pichincha eruptions (October 1999 – July 2000) demonstrating the extensive area affected by ashfalls. Footnotes: The map has been modified from the images of the Volcano Ash Advisory Archive [21], courtesy of Dr. Yepes, the Geophysical Institute of Ecuador.

