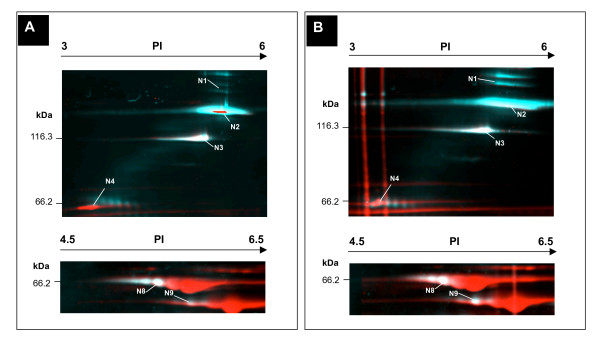
Figure 3.

Comparison of protein phosphorylation between different growth states. Selected sections of the overlay image from the 2D-gel phosphoprotein profile of (A) exponential growth phase and (B) stationary growth phase of M. pneumoniae are shown, with growth cycle determined by wet cell weight as described in the methods. Phosphoproteins were detected by Pro-Q Diamond stain (shown as blue/white) and then the total proteins were labeled by SYPRO Ruby protein stain (shown as red). See Figure 1 and Table 3 for protein numbering and details. A putative structural protein (spots N1 and N2), and heat shock protein GroEL (spot N9) displayed a significant rise in protein phosphorylation when M. pneumoniae was harvested for analysis in the stationary phase.
