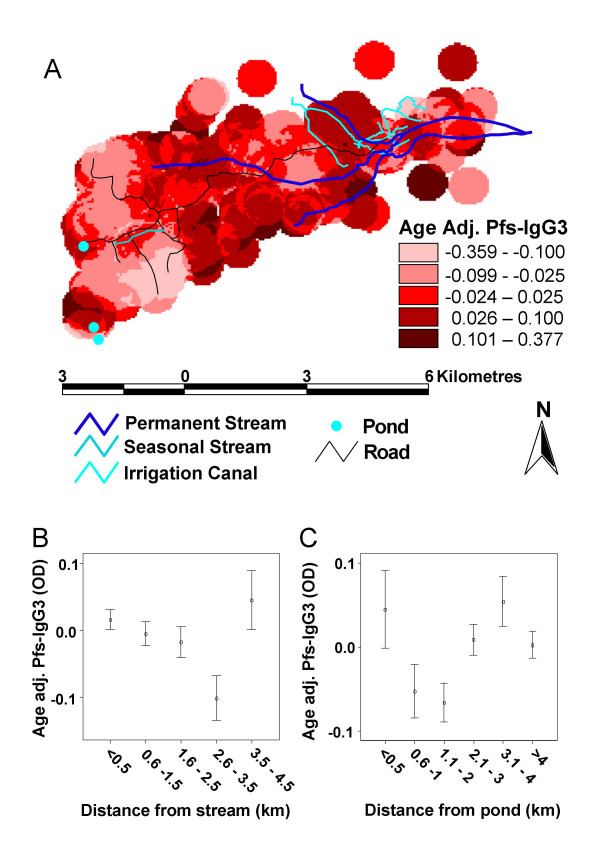
Figure 4.
Microgeographical patterns in age adjusted Pfs-IgG3 levels. (A) Map of mean age-adjusted low transmission season Plasmodium falciparum schizont antigen (Pfs)-IgG3 levels (n = 1044), on a household level. Pfs-IgG3 levels were age-adjusted by linear regression which was split at <= 17-yrs and >17-yrs. (B) Age-adjusted Pfs-IgG3 levels with distance of residence from the nearest permanent stream. Shown are the mean levels +/- 2 standard errors. (C) Age-adjusted Pfs-IgG3 levels with distance of residence from the nearest seasonal pond. Shown are the mean levels +/- 2 standard errors.

