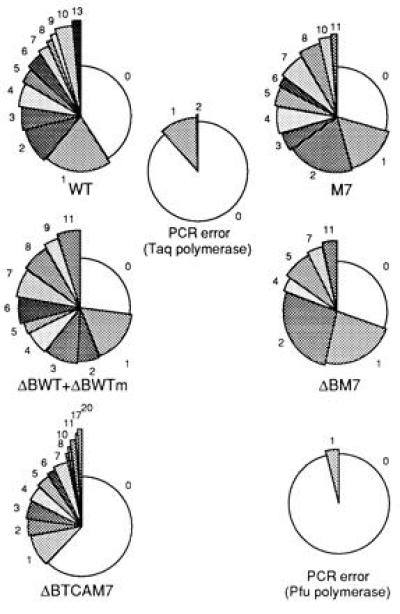
Figure 2.

Frequency distribution of clones with respect to the number of mutations they carry. Each part depicts the proportion of sequences with mutations as specified. The controls for PCR errors for each set of experiments are shown at the center or to the right of the relevant results. PCR errors were measured by sequencing transgenes from characterized hybridomas. ΔBWTm refers to one of the ΔBWT copies that carries an accidental G for A silent substitution in the Lys-18 codon.
