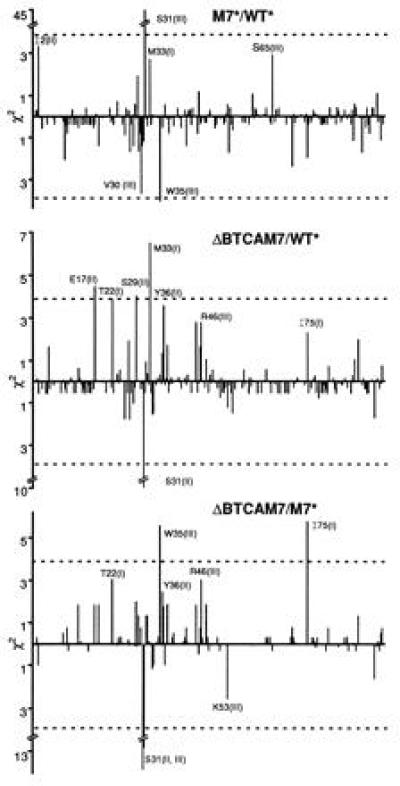
Figure 4.

χ2 Pearson test of statistical significance of the mutability differences between WT*, M7*, and ΔBTCAM7. Vertical lines above and below 0 indicate, respectively, increased or decreased mutation frequency of individual nucleotides. Comparisons are for M7* relative to WT*, ΔBTCAM7 relative to WT*, and ΔBTCAM7 relative to M7*. Broken horizontal line indicates the 95% confidence level.
