
Figure 1.
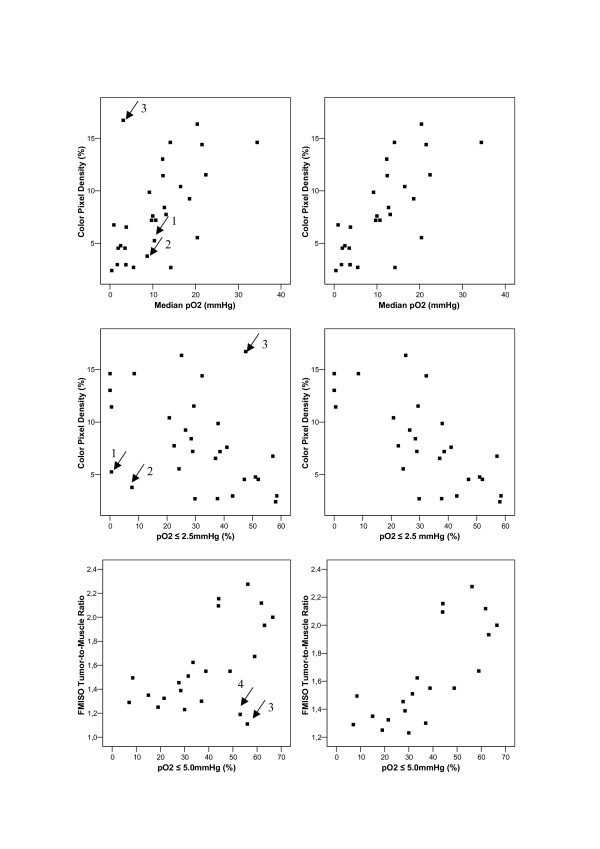
Scatter plots visualizing type of association between selected polarographic parameters (median pO2, hypoxic fraction ≤ 2.5 mmHg and ≤ 5.0 mmHg) and color pixel density (CPD) as well as FMISO tumor to muscle ratio (FMISOT/M) after 2 h (→ marked outliers). Left graphs: scatter plots using all available data values. Right graphs: corresponding scatter plots after exclusion of marked outliers identified in the left graph.