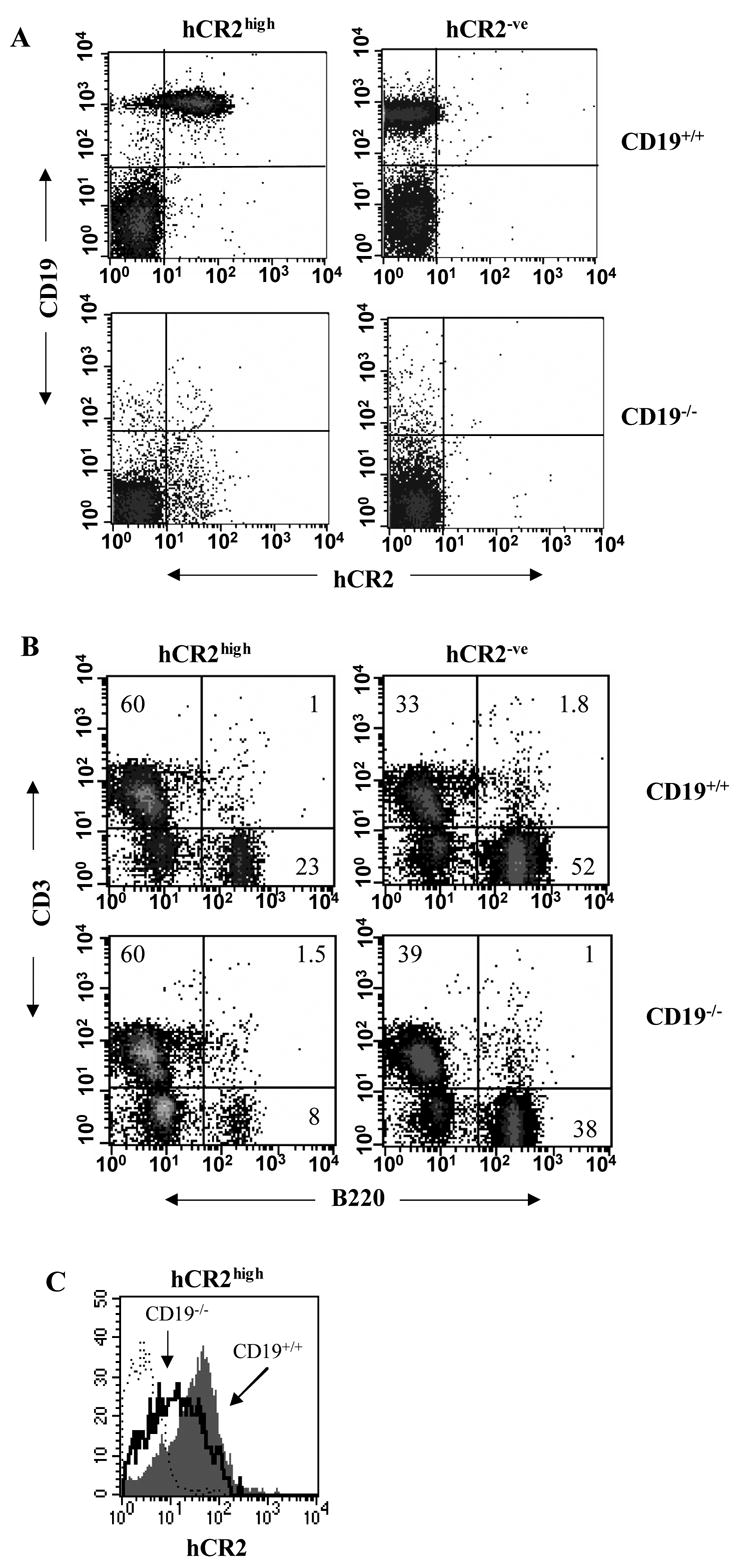
Fig 1. Analysis of CD19−/−hCR2+ tg mouse B cells.

Splenocytes were isolated from littermates of each genotype as indicated in materials and methods. A) Cells were stained for CD19 and hCR2 to confirm the genotype of the mice B) Cells were stained with B220 and anti-CD3ε to identify B and T cells, respectively. The percentage of cells falling into each quadrant is indicated. Results are representative of 10 WT (CD19+/+hCR2−/−), 14 CD19+/+hCR2high, 5 CD19−/−hCR2−/− and 7 CD19−/−hCR2high littermates. C) Expression level of hCR2 was determined on B220 positive splenocytes in the presence (gray filled histogram) or absence (solid black line) of CD19. Background binding of anti-hCR2 to splenocytes from CD19+/+hCR2−/− (dashed line) is also included. Results are representative of 5 CD19−/−hCR2high and 8 CD19+/+hCR2high littermates.
