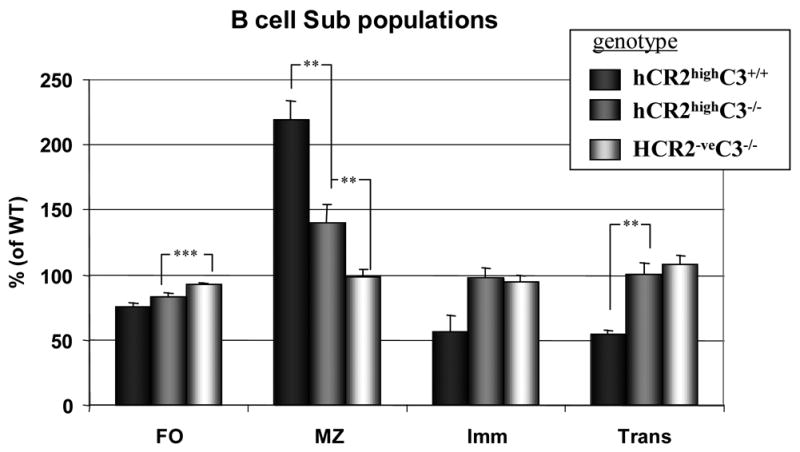
Fig 3. B cell subpopulation distribution is restored towards wild type levels in C3−/− hCR2high mice.

Splenocytes were isolated from littermates of mice with the genotype indicated. Cells were stained with B220-PerCP, Biotin anti-CD23 + SA-APC, anti-CD1d-PE and anti-CD24-FITC to allow B cells to be sub divided into Follicular (FO; B220+CD23hiCD24dullCD1ddull), Marginal Zone (MZ; B220+CD23dullCD24intCD1dhi), Immature (Imm; B220+CD23dullCD24hiCD1dint) and Transitional (Trans; B220+CD23hiCD24hiCD1dint) B cell sub populations. The number of cells falling into each of these groups is expressed as a percentage of mean values for 12 age and sex matched wild type mice. Each bars represent the mean and S.E.M. from 5 C3+/+hCR2high (black filled), 12 C3−/−hCR2high (dark gray filled) and 12 C3−/−hCR2 negative (light gray filled) mice for each sub population. The Mann-Whitney test was used to determine the p values; ** p<0.005; ***p<0.0001.
