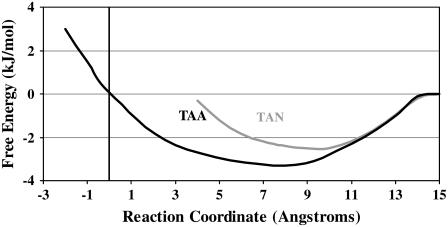
FIGURE 4.
Potential of mean force profile. This figure shows the potential of mean force profile, i.e., free energy, of the proteins as a function of distance from the midpoint of the ice/water face. The x axis represents the distance between the center of the protein helix and the midpoint of the ice/water interfacial region. The midpoint of the interfacial region is defined by the inflection point of the diffusion coefficient profile (43). The y axis represents the free energy of interaction between the protein and the ice/water interfacial region in kJ/mol. The free energy of interaction between the protein and bulk water is set at the reference value of 0 kJ/mol.

