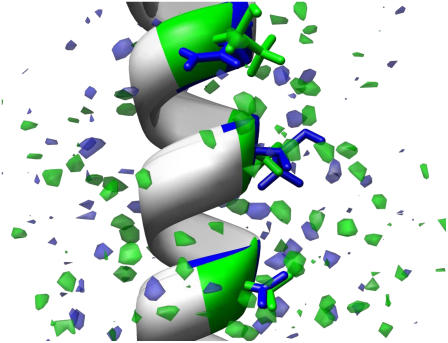
FIGURE 7.
Protein hydration difference maps. A comparison at an equivalent level of hydration for the two interfaces superimposed. The TAA face (residues 17, 21, 24) and its hydration are in the same reference frame as TAN (residues 20, 24, 27). The former is in green, and the latter is in blue. The TAN interface shows much less ordered hydration than the TAA.

