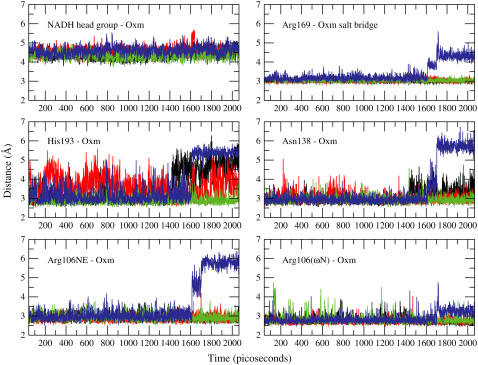
FIGURE 7.
Distance time-series of several active site interacting pairs shown in Fig. 6. Each panel contains an overlay of time-series the specified pair in all four subunits. The coloring scheme is as follows: black, subunit A; red, subunit B; green, subunit C; and blue, subunit D. The distance between centers of mass were plotted for the following pairs: nicotinamide headgroup, oxamate; and guanidino group (starting from Cω) of Arg169, carboxylate group of oxamate. The rest are distances between heavy atoms of hydrogen-bond donor/acceptor. Arg106NE, His193, and Asn138 all approach the carbonyl oxygen of oxamate. Nω is a terminal nitrogen of the arginine side chain that interacts with one of the carboxylate oxygens of oxamate. All y axes units are distance in Ångstroms (Å) and x axes are time in picoseconds.

