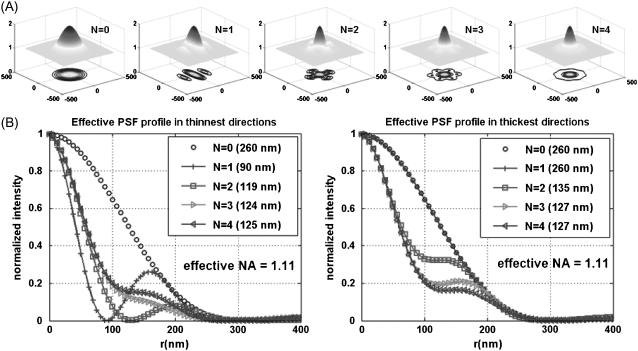
FIGURE 1.
(A) Effective PSF simulation of 2D SW-TIRF for directions N = 0, 1, 2, 3, and 4. N = 0 corresponds to the conventional TIRF. Anisotropy of PSF decreases as N increases (N: number of scan directions). (B) Comparison of the PSF profile in the thinnest and the thickest directions. All the other cross sectional profiles lie between these two profiles for corresponding N. Simulation condition: NA = 1.45, α = 1.0, 
 n = 1.52,
  (or fringe period = 190 nm).

