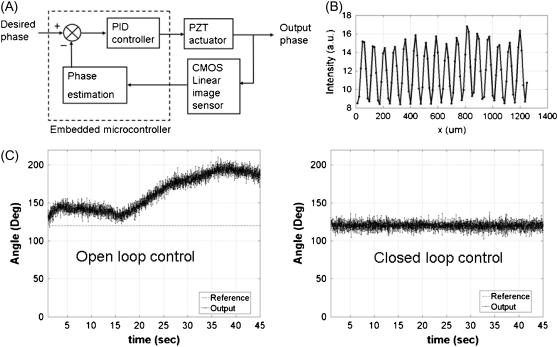
FIGURE 3.
SW phase control with closed loop feedback controller. (A) Schematic diagram of the SW phase closed loop control unit. The embedded microcontroller monitors the output phase from the CMOS detector and this estimated phase is used to control input in real time (∼70 Hz). (B) Typical fringe pattern on CMOS image sensor. The invisible evanescent SW on the sample can be indirectly monitored in this alternative way. (C) SW fringe phase measurement with a feedback loop open (left) and closed (right). Reference angle: 120° and measurement duration: 0.2–45 s. The standard deviation of the fluctuation is <3°.

