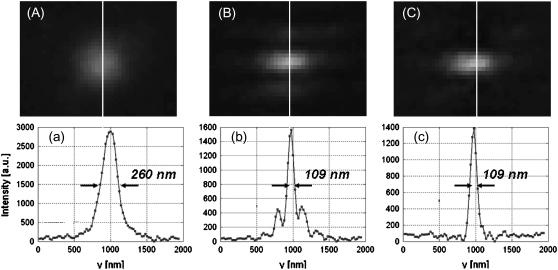
FIGURE 4.
Effective PSF measurement of (A) conventional TIRF, (B) 1D SW-TIRF, and (C) 1D SW-TIRF with linear deconvolution with a 0.04-μm fluorescent bead. The evanescent standing excitation is in the vertical direction. The corresponding vertical intensity profile is (a), (b), and (c). These vertical profiles show a narrower PSF FWHM for SW-TIRF in comparison with that of conventional TIRF. (Experimental condition is the same as that of numerical simulation: NA = 1.45, 
 n = 1.52, and
  ± 0.5° except the contrast was typically measured ∼0.9.)

