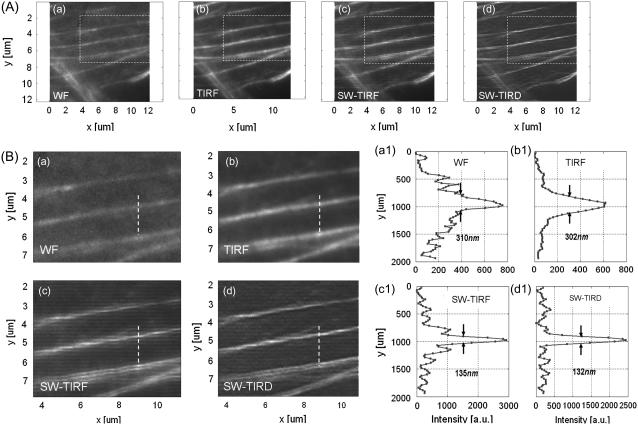
FIGURE 6.
F-actin cytoskeleton in mouse fibroblast cells (NIH 3T3) imaged with (a) WF, (b) conventional TIRF, (c) 1D SW-TIRF, and (d) 1D SW-TIRF with linear deconvolution (SW-TIRD). B (a–d) are enlarged insets of corresponding image from A (a–d). B (a1–d1) are the vertical profiles of dashed line in the corresponding image B (a–d). The evanescent standing excitation is in the vertical direction.

