FIGURE 3.
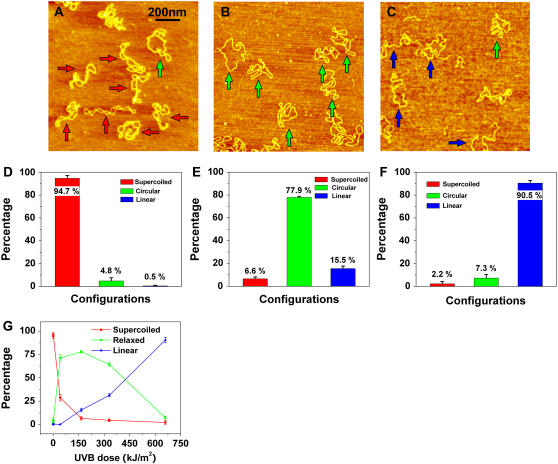
AFM images of pUC18 molecules subjected to different doses of UVB radiation: (A) 1.4 kJ/m2, (B) 165 kJ/m2, (C) 660 kJ/m2. Scan size in all the images is 1 × 1 μm2. (D–F) Histograms of the occurrence of various configurations of pUC18 plasmids determined from the AFM images such as these shown in (A–C). Color code and error bar are the same as in Fig. 2. Each histogram is based on 18–25 AFM images. (G) Percentages of different configurations of irradiated pUC18 as a function of UVB dose.

