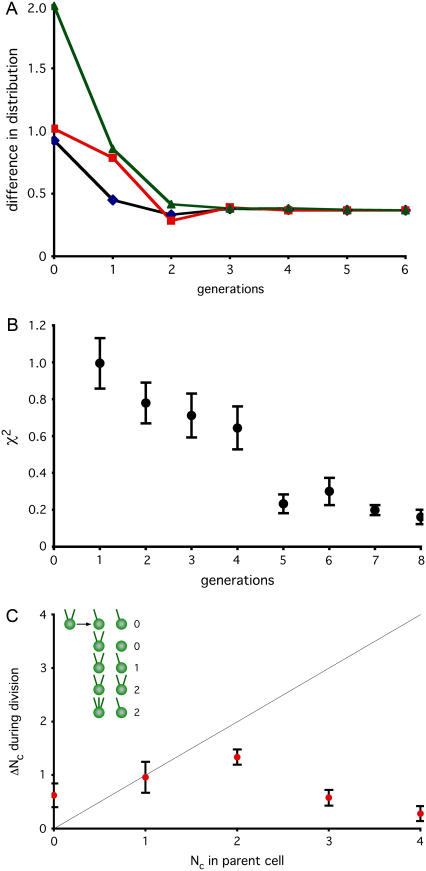
FIGURE 3.
Error correction still occurs when centrioles are dissociated from spindle. (A) Modeling restoration without segregation. A matrix describing inheritance with de novo assembly and number limiting but random segregation (Fig. 1 G) was used to simulate recovery in cells lacking centriole association with mitotic spindle. Initial distribution was set either to a uniform distribution (black line), all cells containing zero centrioles (red line) or all cells containing four centrioles (green line). Successive rounds of matrix multiplication were used to simulate changes in distribution per generation of cell division. At each generation, the distribution was compared to the measured distribution in vfl2 mutants and the difference in calculated and measured distributions was computed using the variational distance measure. (B) Restoration of steady-state vfl2 centriole distribution following perturbation. Mutant vfl2 cells have a variable number of centrioles per cell, with numbers found in a characteristic distribution (see Fig. 2 A). Individual vfl2 cells, having zero, one, or two centrioles, were seeded into wells of 96-well microtiter plate and allowed to undergo multiple rounds of division. At regular time points, cells were observed and the motility of all cells in a well scored to determine the number of centrioles present. For each well, at each generation observed, the distribution of numbers in the well was compared with the normal population-level distribution seen in vfl2 and the difference characterized by the χ-squared statistic. Results for each generation were averaged and plotted. Results were obtained from a total of 176 individual cells (116 with zero centrioles, 27 with one, and 33 with two) tracked from 0 to 4 days. (C) Error correction detected during division of living cells. Individual vfl2 cells were embedded in agarose and were observed before and after division. Graph shows average number of new centrioles (represented on the vertical axis by ΔNc, the change in the number of centrioles) made in a single division plotted versus centriole copy number (Nc) of the parent cell. Only successful cell divisions resulting in viable progeny (as judged by cell morphology and ability to continue dividing at least once more) were included in the plot. Gray line shows prediction for ideal duplication in which each centriole produces exactly one new centriole (hence a line with a slope of 1). Values falling above the line for low Nc and below the line for Nc indicate modulation of duplication in response to centriole copy number. Error bars represent standard error of the mean. Data based on observation of 254 successful cell divisions. Inset illustrates how ΔNc is calculated, by indicating all observed outcomes for division of a cell with two flagella and therefore two centrioles, and showing the calculated value for ΔNc in each case, found by summing the total number of centrioles (as judged by flagella) in both daughters and subtracting the number of centrioles in the mother.

