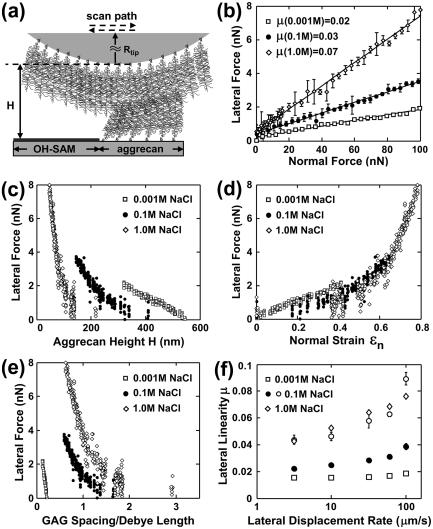
FIGURE 1.
(a) Lateral motion of two opposing aggrecan layers using an aggrecan functionalized probe tip (Rtip ∼ 2.5 μm) on an aggrecan-OH-SAM micropatterned sample. (b) Lateral versus applied normal force (mean ± SD, n = 8 different locations), 95% confidence interval of μ < ± 0.01, estimated via least-squares linear regression (LSLR), R2 > 0.92 for all IS. (c) Lateral force versus total height H of two aggrecan layers. (d) Lateral force versus normal strain ɛn. (e) Lateral force versus estimated ratio of GAG spacing to Debye length. Each data point in panels c–e represents one lateral scan. (f) Lateral proportionality μ versus lateral tip displacement rate (mean ± 95% confidence interval at n = 8 different locations via LSLR, R2 > 0.88 for all data). Open circles denote μ measured via an OH-SAM tip at 0.1 M IS, adapted from Han et al. (3) (R2 > 0.81 for all data). Effects of displacement rate (one-way ANOVA, p < 0.0001 at all IS) and IS (two-way ANOVA, p < 0.0001) are significant. Experiments performed in NaCl, pH ∼ 5.6.

