FIGURE 2.
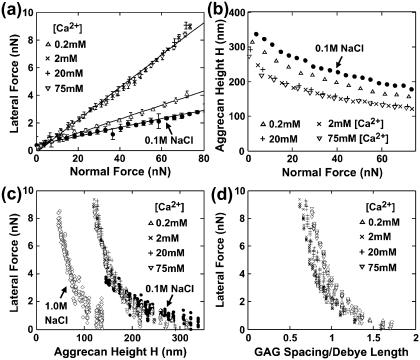
(a) Lateral versus applied normal force (mean ± SD, n = 8 different locations), μ = 0.05 at 0.2 mM [Ca2+] and 0.12 at 2–75 mM [Ca2+], 95% confidence interval of μ < ± 0.01 via LSLR, R2 > 0.97 for all [Ca2+]. (b) Aggrecan total height H versus applied normal force (n = 8, mean ± SD < data size). (c) Lateral force versus height H. (d) Lateral force versus estimated ratio of GAG spacing to Debye length. In panels c and d, each data point represents one lateral scan. Experiments performed in NaCl + CaCl2 solutions with [Cl−] = 0.15 M, varying [Ca2+] and [Na+]; pH ∼ 5.6. Data at 0.1 M NaCl in panel b is adapted from Dean et al. (5), for comparison.

