Fig. 1.

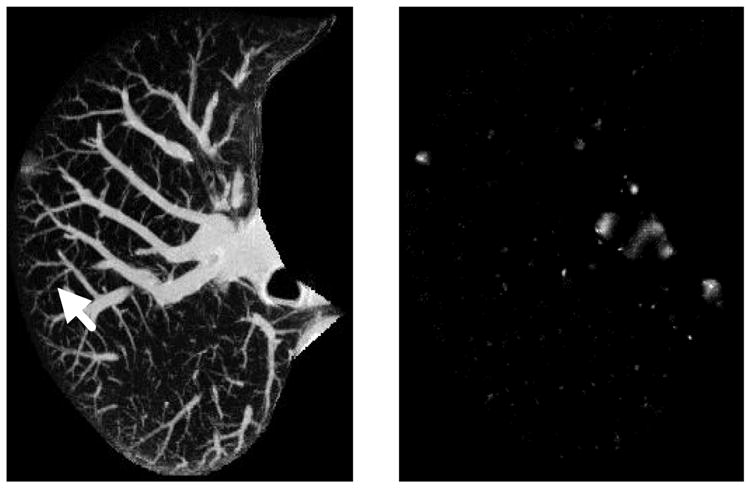
Maximum intensity projection of a 3D CT original image with a cancer, indicated by an arrow, and a nodule-enhanced image, in which the nodule was enhanced and blood vessels were suppressed substantially.

Maximum intensity projection of a 3D CT original image with a cancer, indicated by an arrow, and a nodule-enhanced image, in which the nodule was enhanced and blood vessels were suppressed substantially.